Financial Summary
Five Year Financial Summary
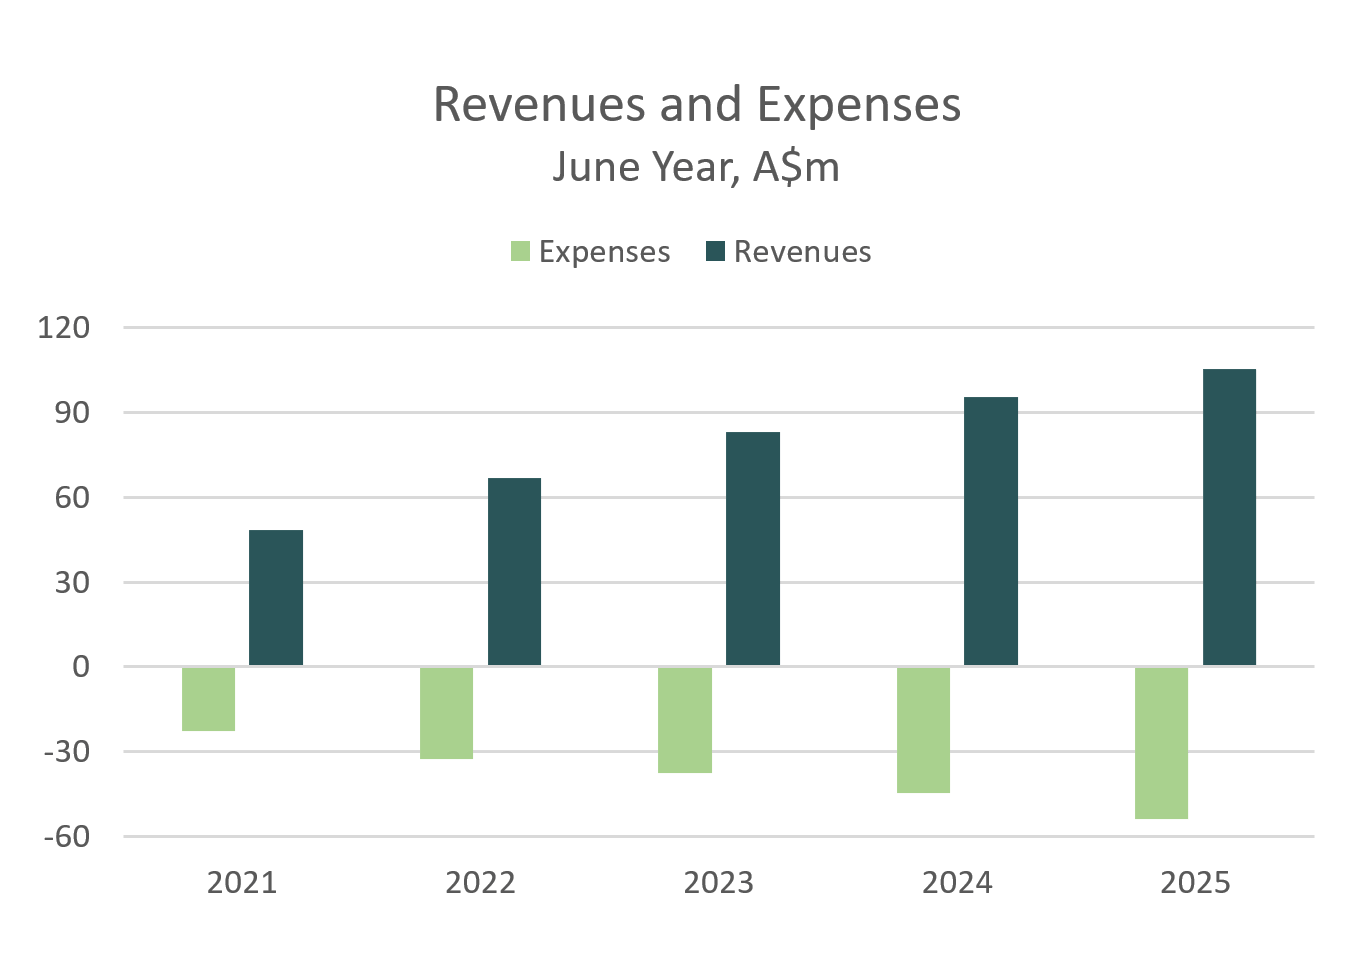
| Profit & Loss | FY2025 | FY2024 | FY2023 | FY2022 | FY2021 | |
|---|---|---|---|---|---|---|
| Revenues | A$m | 105.3 | 95.3 | 83.0 | 67.0 | 48.5 |
| Expenses | A$m | 53.7 | 44.6 | 37.4 | 32.7 | 22.7 |
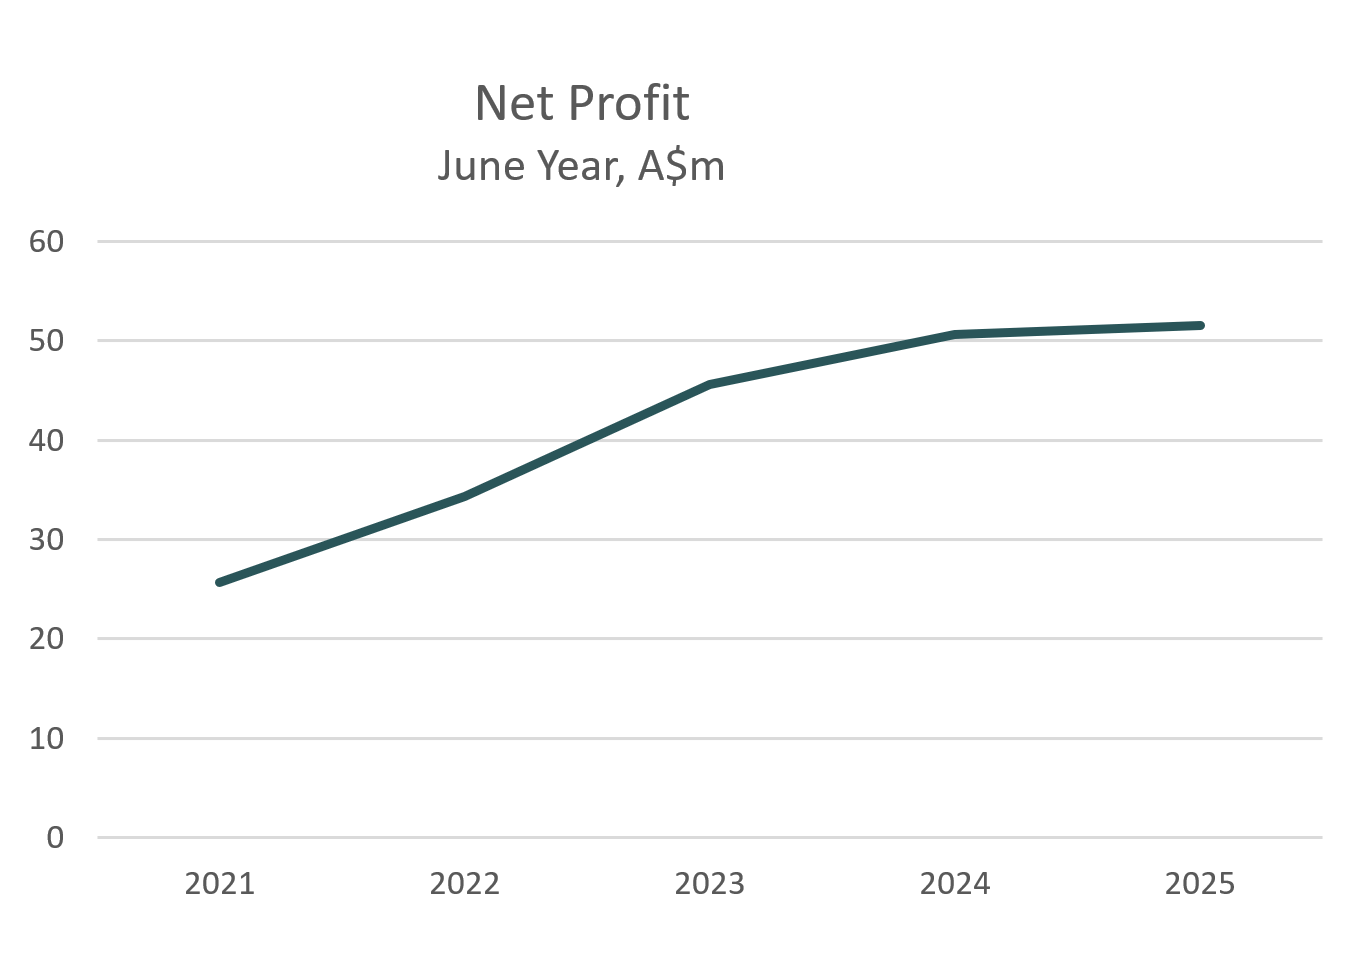
| Net Profit / (Loss) | A$m | 36.2 | 35.6 | 30.6 | 20.9 | 24.7 |
| Balance Sheet | FY2025 | FY2024 | FY2023 | FY2022 | FY2021 | |
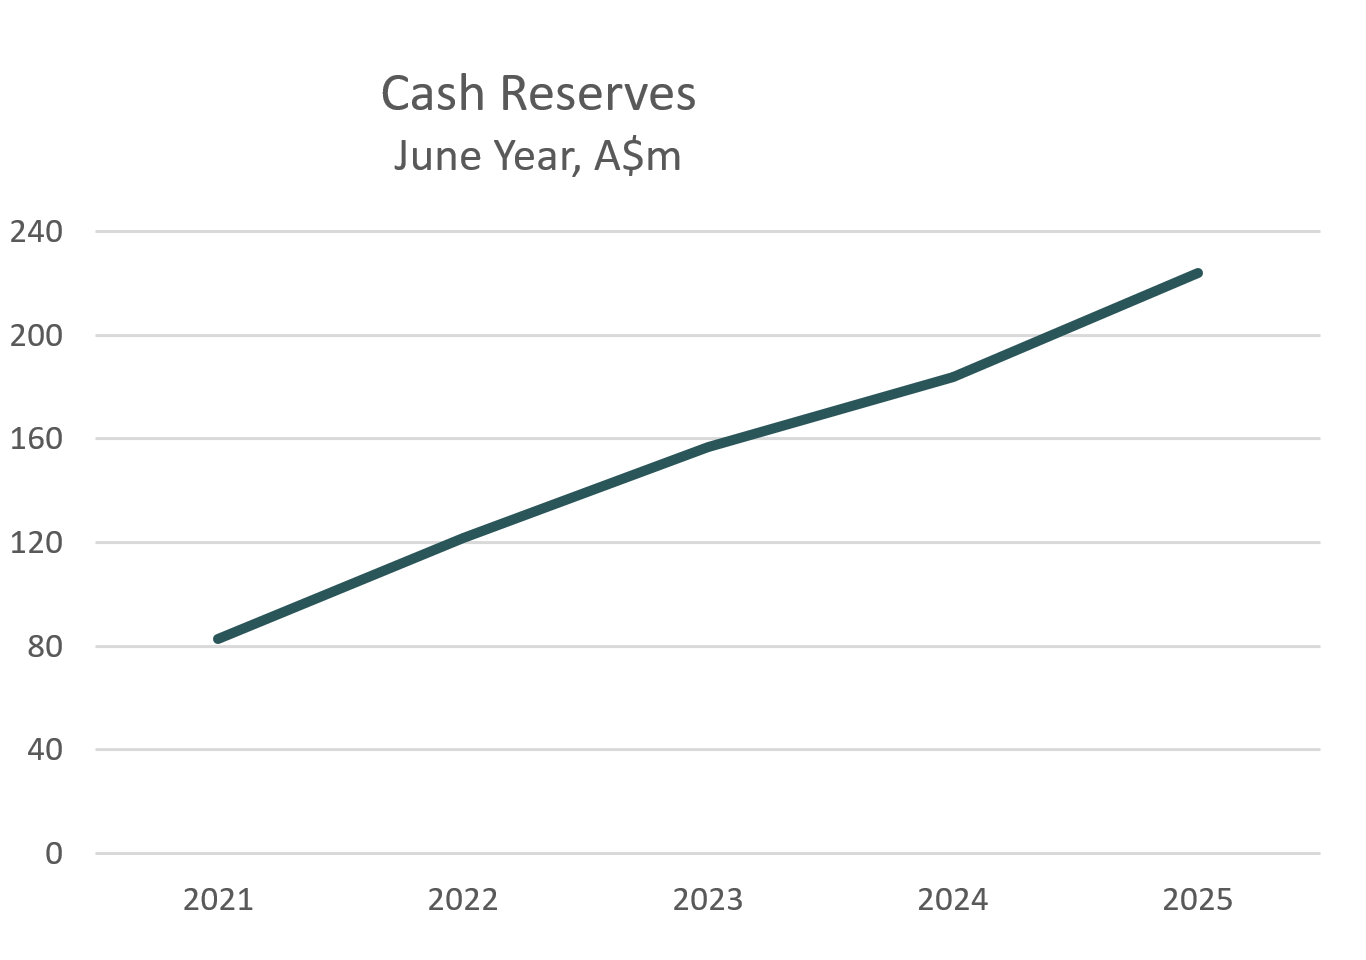
| Cash reserves | A$m | 224.1 | 183.9 | 156.8 | 121.5 | 82.7 |
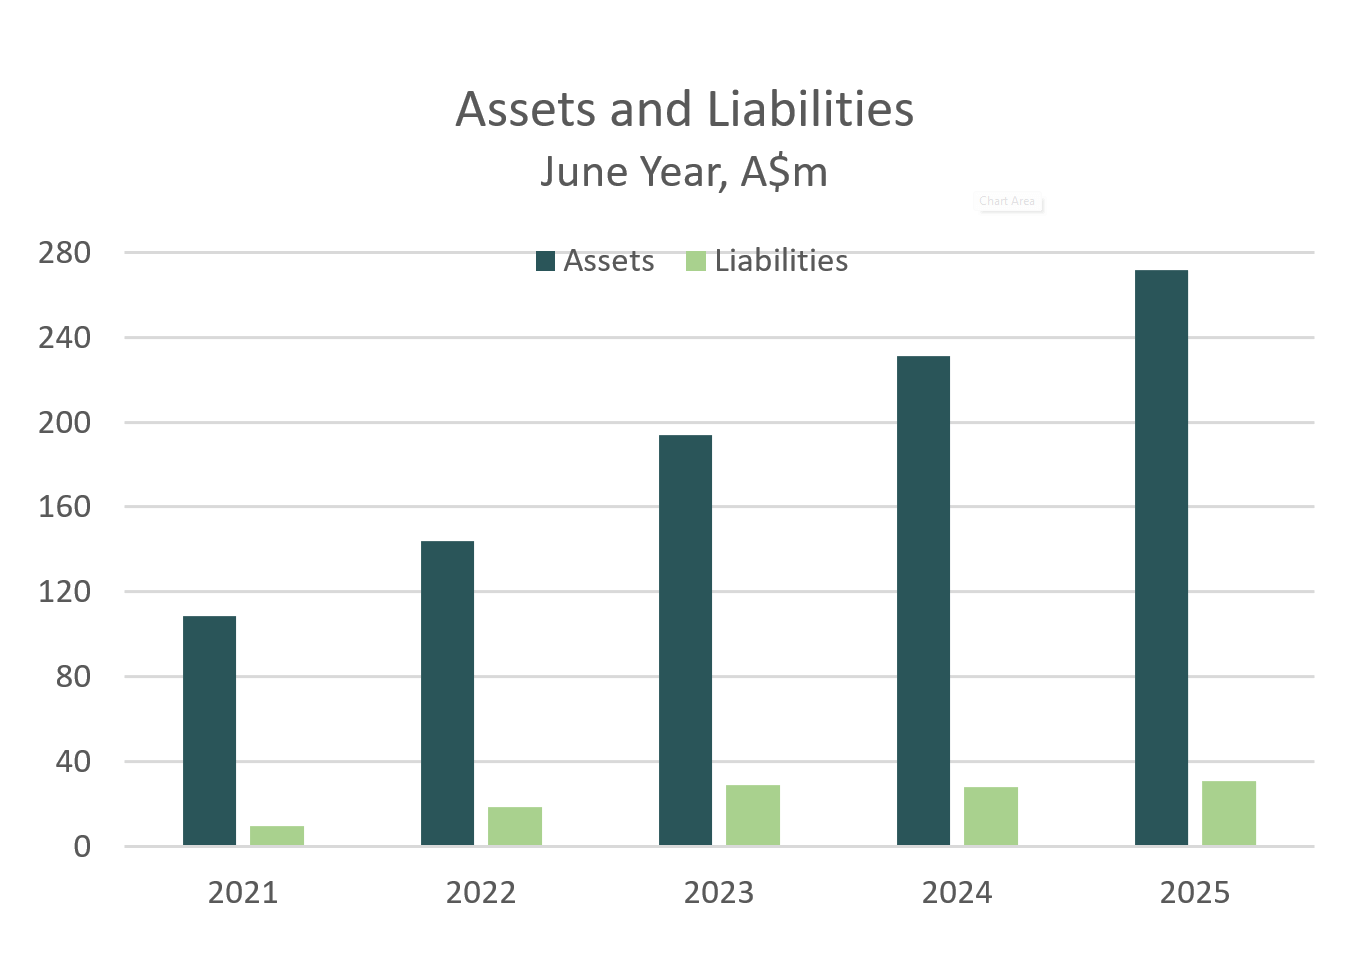
| Total Assets | A$m | 271.8 | 231.1 | 193.7 | 143.9 | 108.6 |
| Total Liabilities | A$m | 30.9 | 28.1 | 29.1 | 18.4 | 9.8 |
| Equity | A$m | 240.8 | 203.0 | 164.6 | 125.6 | 98.7 |
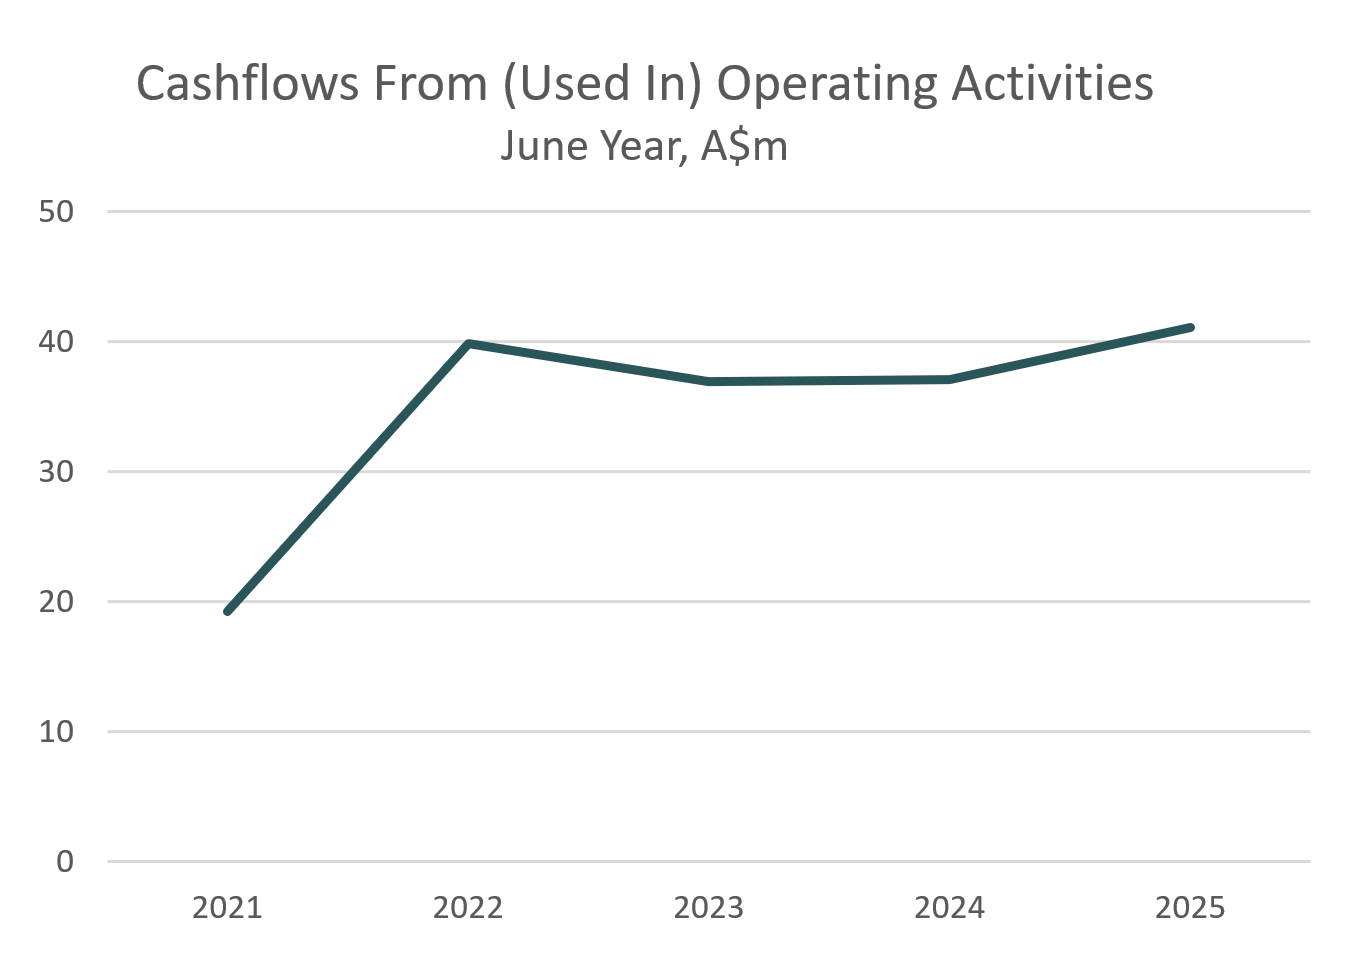
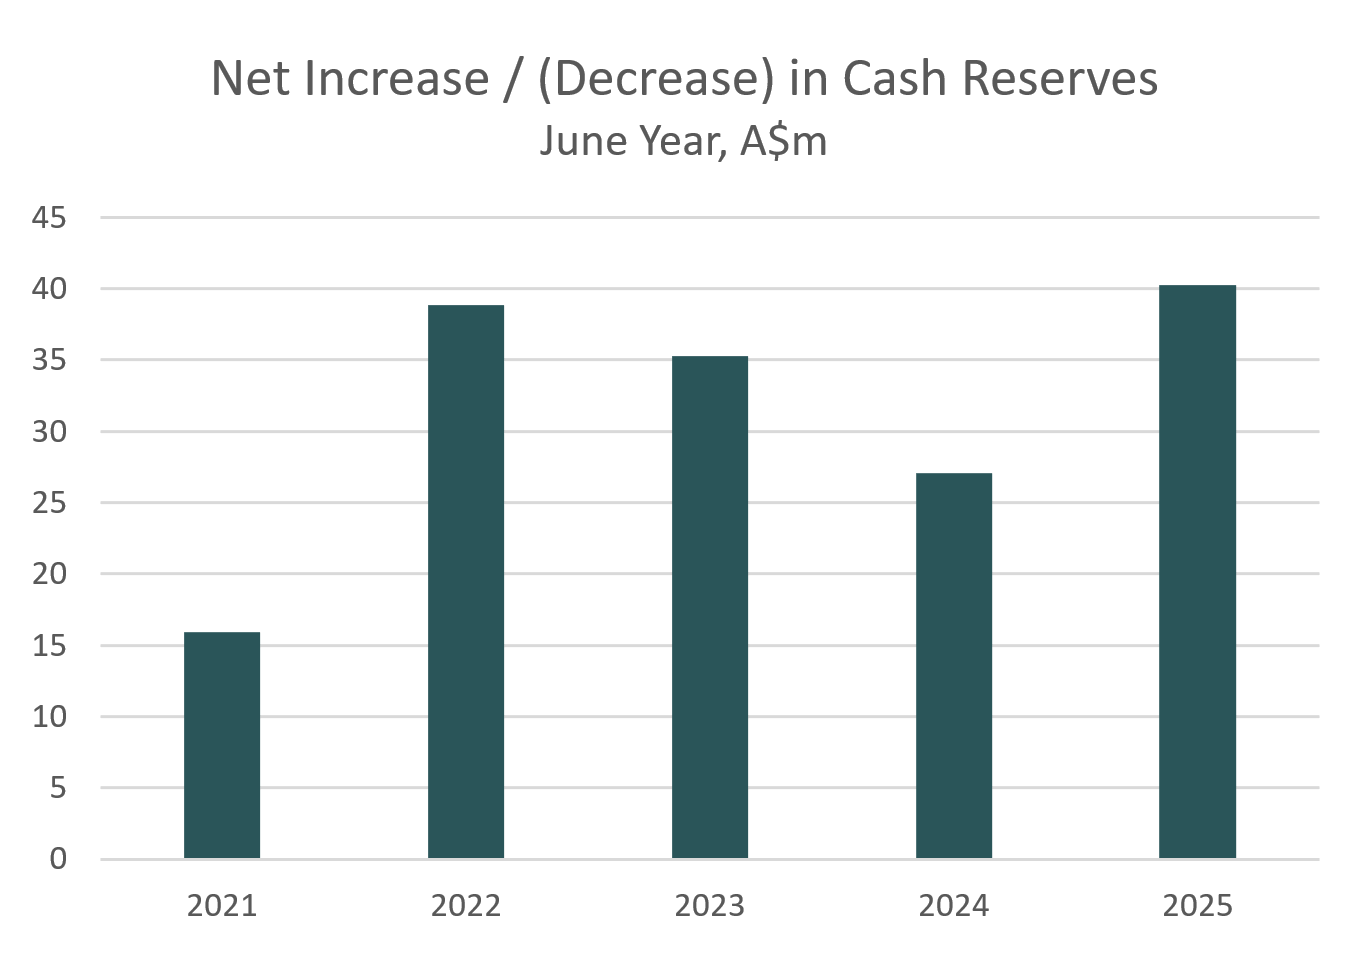
| Cash Flow | FY2025 | FY2024 | FY2023 | FY2022 | FY2021 | |
| Cashflow (used in ) operating activities | A$m | 41.1 | 37.1 | 36.9 | 39.9 | 19.3 |
| Net increase in cash reserves | A$m | 40.2 | 27.1 | 35.3 | 37.9 | 16.9 |
| Key Variables | FY2025 | FY2024 | FY2023 | FY2022 | FY2021 | |
| Basic Earnings per Share | Cents | 72.2 | 71.5 | 61.9 | 42.3 | 50.0 |
| Net Tangible Assets Backing | A$ per share | 4.8 | 4.0 | 3.3 | 2.5 | 1.9 |
| Return on Equity | % | 16 | 18 | 19 | 17 | 25 |
Capital raisings
CLINUVEL has raised over A$95.0 million since 2006 to fund its clinical programme for afamelanotide.
| Date | Amount Raised A$m |
Shares Issued millions |
Price* A$ |
|---|---|---|---|
| Sep 2006 Rights Issue and Placement | 35.2 | 9.10 | 3.85 |
| Apr 2007 Placements | 26.0 | 2.40 | 10.70 |
| Jun 2012 Placements | 6.0 | 3.40 | 1.75 |
| May 2013 Placements | 6.3 | 2.98 | 2.14 |
| Jun 2014 Placements | 7.2 | 4.17 | 1.67 |
| Mar 2016 Placements | 8.3 | 2.53 | 3.30 |
* Represented on post-consolidated basis after capital re-organisation November 2010 (10:1 Reverse Stock Split)